性能压测工具 perftest
概述
perftest 是一个轻量高性能的开源压测工具,支持 单机压测 和 分布式集群压测 两种模式,既能满足开发阶段的小规模验证,也能模拟生产环境的真实高并发场景。
功能特性
- ✅ 单机压测:快速验证接口功能与初步性能评估。
- ✅ 分布式集群压测:突破单机瓶颈,模拟真实业务高并发。
- ✅ 多协议支持:支持 HTTP/1.1、HTTP/2、HTTP/3、WebSocket。
- ✅ 实时监控:压测过程中的 QPS、延迟分布、数据传输、状态码统计等数据实时推送到自定义 HTTP 端点或 Prometheus 监控系统。
- ✅ Websocket 消息性能测试: 支持自定义消息内容和发送间隔,模拟业务场景中的消息推送场景。
安装
go install github.com/go-dev-frame/sponge/cmd/sponge@latest安装完成后,执行 sponge perftest -h 查看帮助。
单机压测
perftest 支持单机压测,单机压测就是在一台机器上发起大量请求,通常用于验证接口功能与初步性能评估。
为什么要单机压测?
验证接口是否正常
- 检查 API 功能是否正确、返回是否符合预期。
- 发现明显的 bug,例如参数处理错误、响应超时、状态码异常。
初步性能基线
- 大概能承受多少 QPS(请求数/秒)。
- 响应延迟(p50、p95、p99)情况如何。
- 是否有明显的瓶颈(数据库慢、锁竞争、内存不足)。
开发阶段调优
- 本地开发环境做快速回归。
- 单台机器的测试更容易重现问题。
单机压测更多是“接口调试 + 小规模性能测试”,能帮你发现系统明显的性能短板。
1. HTTP/1.1 单机压测示例
# 默认参数:3*CPU 个并发,5000 次请求,GET 方法
sponge perftest http --url=http://localhost:8080/user/1

# 固定请求数:3*CPU 个并发,500k 次请求,POST 方法,带 JSON 请求体
sponge perftest http --total=500000 --method=POST \
  --url=http://localhost:8080/user \
  --body="{\"name\":\"Alice\",\"age\":25}"

# 固定持续时间:3*CPU 个并发,持续 10s,GET 方法
sponge perftest http --worker=50 --duration=10s --url=http://localhost:8080/user/1

# 固定请求数: 3*CPU 个并发, 500k 次请求, GET 方法, 每秒推送统计数据到自定义 HTTP 端点
sponge perftest http --total=500000 \
  --url=http://localhost:8080/user/1 \
  --push-url=http://localhost:9090/report

# 固定持续时间: 3*CPU 个并发, 持续 10s, GET 方法, 每秒推送统计数据到 Prometheus (job=xxx)
sponge perftest http --duration=10s \
  --url=http://localhost:8080/user/1 \
  --push-url=http://localhost:9091 \
  --prometheus-job-name=perftest-http
测试报告示例:
========== HTTP/1.1 Performance Test Report ==========

[Requests]
  • Total Requests:    1000000
  • Successful:        1000000 (100%)
  • Failed:            0
  • Total Duration:    7.14 s
  • Throughput (QPS):  139981.2 req/sec

[Latency]
  • Average:           0.34 ms
  • Minimum:           0 ms
  • Maximum:           24.99 ms
  • P25:               0 ms
  • P50:               0 ms
  • P95:               1.04 ms
  • P99:               2.1 ms

[Data Transfer]
  • Sent:              25000000 Bytes
  • Received:          49000000 Bytes

[Status Codes]
  • 200:               1000000
2. HTTP/2 单机压测示例
与 HTTP/1.1 使用方式相同,只需将 http 替换为 http2:
# 固定请求数: 3*CPU 个并发, 500k 次请求, GET 方法
sponge perftest http2 --total=500000 --url=https://localhost:6443/user/1

# 固定持续时间: 3*CPU 个并发, 持续 10s, GET 方法
sponge perftest http2 --duration=10s --url=https://localhost:6443/user/1
3. HTTP/3 单机压测示例
与 HTTP/1.1 使用方式相同,只需将 http 替换为 http3:
# 固定请求数: 3*CPU 个并发, 500k 次请求, GET 方法
sponge perftest http3 --total=500000 --url=https://localhost:8443/user/1

# 固定持续时间: 3*CPU 个并发, 持续 10s, GET 方法
sponge perftest http3 --duration=10s --url=https://localhost:8443/user/1
4. WebSocket 单机压测示例
# 默认模式:10 并发,持续 10s,随机消息(100 字符)
sponge perftest websocket --worker=10 --duration=10s --url=ws://localhost:8080/ws

# 发送固定字符串消息,每个worker发送消息间隔 10ms
sponge perftest websocket --worker=100 --duration=1m \
  --send-interval=10ms \
  --body-string=abcdefghijklmnopqrstuvwxyz \
  --url=ws://localhost:8080/ws

# 发送 JSON 消息,每个worker连续重复发送消息
sponge perftest websocket --worker=10 --duration=10s \
  --body='{"name":"Alice","age":25}' \
  --url=ws://localhost:8080/ws

# 发送 JSON 消息,每个worker发送消息间隔 10ms
sponge perftest websocket --worker=100 --duration=1m \
  --send-interval=10ms \
  --body='{"name":"Alice","age":25}' \
  --url=ws://localhost:8080/ws
测试报告示例:
========== WebSocket Performance Test Report ==========

[Connections]
  • Total:              10
  • Successful:         10 (100%)
  • Failed:             0
  • Latency:            min: 14.80 ms, avg: 14.80 ms, max: 14.80 ms

[Messages Sent]
  • Total Messages:     2954089
  • Total Bytes:        295408900
  • Throughput (QPS):   590817.80 msgs/sec

[Messages Received]
  • Total Messages:     2954089
  • Total Bytes:        295408900
  • Throughput (QPS):   590817.80 msgs/sec
分布式集群压测
当单机压测的能力不足时,perftest 可以帮助您构建一个压测集群,以产生海量负载,发现全链路的性能问题。
为什么需要分布式压测?
单机负载测试无法复刻现代生产环境的复杂性和规模。采用分布式方案至关重要,因为它能:
- 突破单机瓶颈
- 将负载分散到多台 agent 机器上,每台机器只产生总流量的一部分。
- 汇集所有机器的性能,以模拟百万甚至千万级的并发请求。
- 模拟真实用户行为
- 模拟来自不同地理区域和网络环境(如延迟、丢包)的用户。
- 从多个节点发起的请求能更准确地还原真实世界的使用场景。
- 发现大规模系统问题
- 验证负载均衡器是否能正确分发流量。
- 检测分布式缓存或数据库集群中是否存在热点问题。
- 排查网络瓶颈,如带宽耗尽或 NAT 表溢出。
- 验证弹性与扩容能力
- 测试云原生服务的自动扩缩容能力。
- 模拟业务高峰流量,检验您的基础设施是否能按预期水平扩展。
核心架构
perftest 集群由两个核心组件构成:
- Collector (Master): 中央控制节点,负责创建压测会话、协调 agent 节点,并实时汇聚性能测试结果。
- Agent: 工作节点,负责执行实际的压测任务,并将性能指标推送给 Collector。
框架图如下:
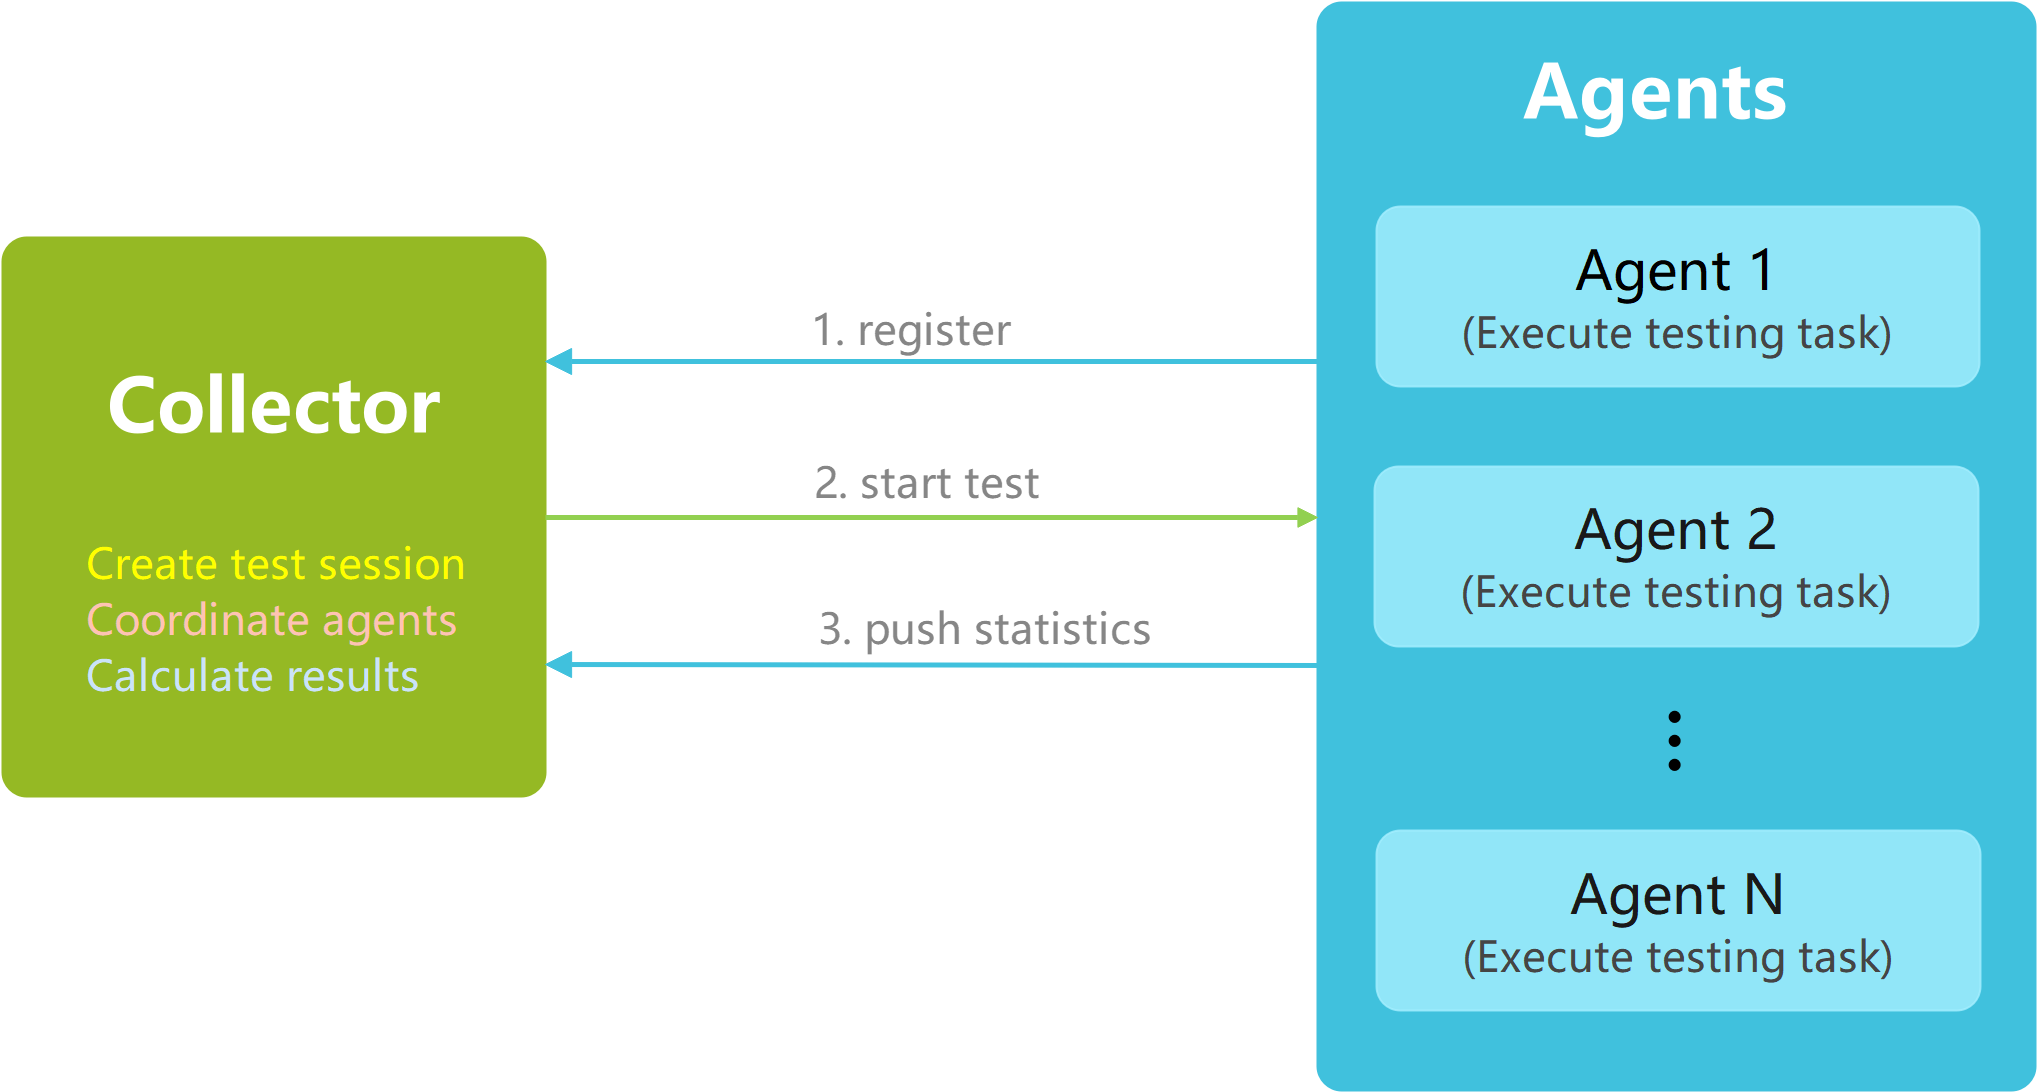
这种简洁的 Master-Agent 架构使得扩展压测能力变得非常容易——只需增加更多的 agent 节点即可。
测试工作流
- 启动 Collector: Collector 服务启动并提供一个 Web 管理界面。
- 创建测试会话: 在 Web 界面中,指定期望参与测试的 agent 节点数量,然后开始一个新的会话。
- 启动 Agent: 每个 agent 启动后,会读取其配置文件并自动向 Collector 注册。
- 开始测试: 一旦达到预设数量的 agent 完成注册,Collector 会通知所有 agent 同时开始压测。
- 汇聚结果: Agents 将性能数据(吞吐量、延迟等)实时推送到 Collector,由 Collector 在仪表盘上实时展示。
提示: Agent 会主动监听其
agent.yml配置文件。任何更改都会被自动热加载,无需重启 agent 进程,这使得调整测试参数非常便捷。
快速开始:一个简单的集群示例
让我们搭建一个由一个 Collector 和三个 Agent 组成的小型集群。
- 机器 1 (Collector):
192.168.1.20 - 机器 2 (Agent 1):
192.168.1.101 - 机器 3 (Agent 2):
192.168.1.102 - 机器 4 (Agent 3):
192.168.1.103
第 1 步:运行 Collector
在机器 1 (192.168.1.20) 上,启动 Collector 服务:
sponge perftest collector您将看到以下输出:
2025/09/20 17:33:49 collector server starting on port 8888
[Tip]: access 'http://localhost:8888' in the browser to enter the testing interface

2025/09/20 17:33:49 waiting for create a new test session...
现在,打开浏览器并访问 http://192.168.1.20:8888。在 UI 界面中,输入 agent 数量 (3),然后点击 “开始测试” 来创建新测试会话。Collector 将开始等待三个 agent 的连接。
第 2 步:配置并运行 Agent
在每台 agent 机器上,创建一个 agent.yml 配置文件。
agent.yml 示例:
# 1. 协议配置 (支持: http | http2 | http3)
protocol: http

# 2. 目标 API 配置
testURL: "http://localhost:8080/get"
method: "GET"        # 支持的方法: GET | POST | PUT | PATCH | DELETE
body: ""             # 支持的数据类型: JSON, Form-data, Text. 例如: "{\"key\": \"value\"}"
headers:
  - "Authorization: Bearer <token>"
  #- "Content-Type: application/json"

# 3. 压测策略 (二选一: 固定时长或固定请求数)
duration: 10s             # 例如: 10s, 1m, 2h
# total: 500000           # 总请求数

# 4. 服务发现,确保 collector 服务和 agent 服务能互相通信
collectorHost: "http://192.168.1.20:8888"     # Collector 服务的地址
agentHost: "http://<agent-host-ip>:6601"      # 当前 agent 可被访问的 IP 和端口
agentPushInterval: 1s                         # 指标推送频率
重要提示:
- 请将
agentHost中的<agent-host-ip>替换为每台 agent 机器的实际 IP (例如192.168.1.101、192.168.1.102、192.168.1.103)。 - 对于同一次测试会话,所有 agent 配置文件中的
testURL和method必须完全一致。
现在,分别在机器 2、3、4 上启动 agent 进程:
sponge perftest agent --config=agent.ymlAgent 启动后会自动向 Collector 注册。为了保证注册成功,所有 Agent 的 agent.yml 配置文件中的 testURL 和 method 必须与第一个成功注册的 Agent 保持一致。如果注册失败,请检查 Collector 是否已创建压测会话以及各 Agent 配置是否统一。
当所有3个 Agent 都注册成功后,Collector 会自动协调所有 Agent 同步开始测试。测试界面的图表会实时展示吞吐量、延时、数据传输、状态码分布、错误信息等关键指标。
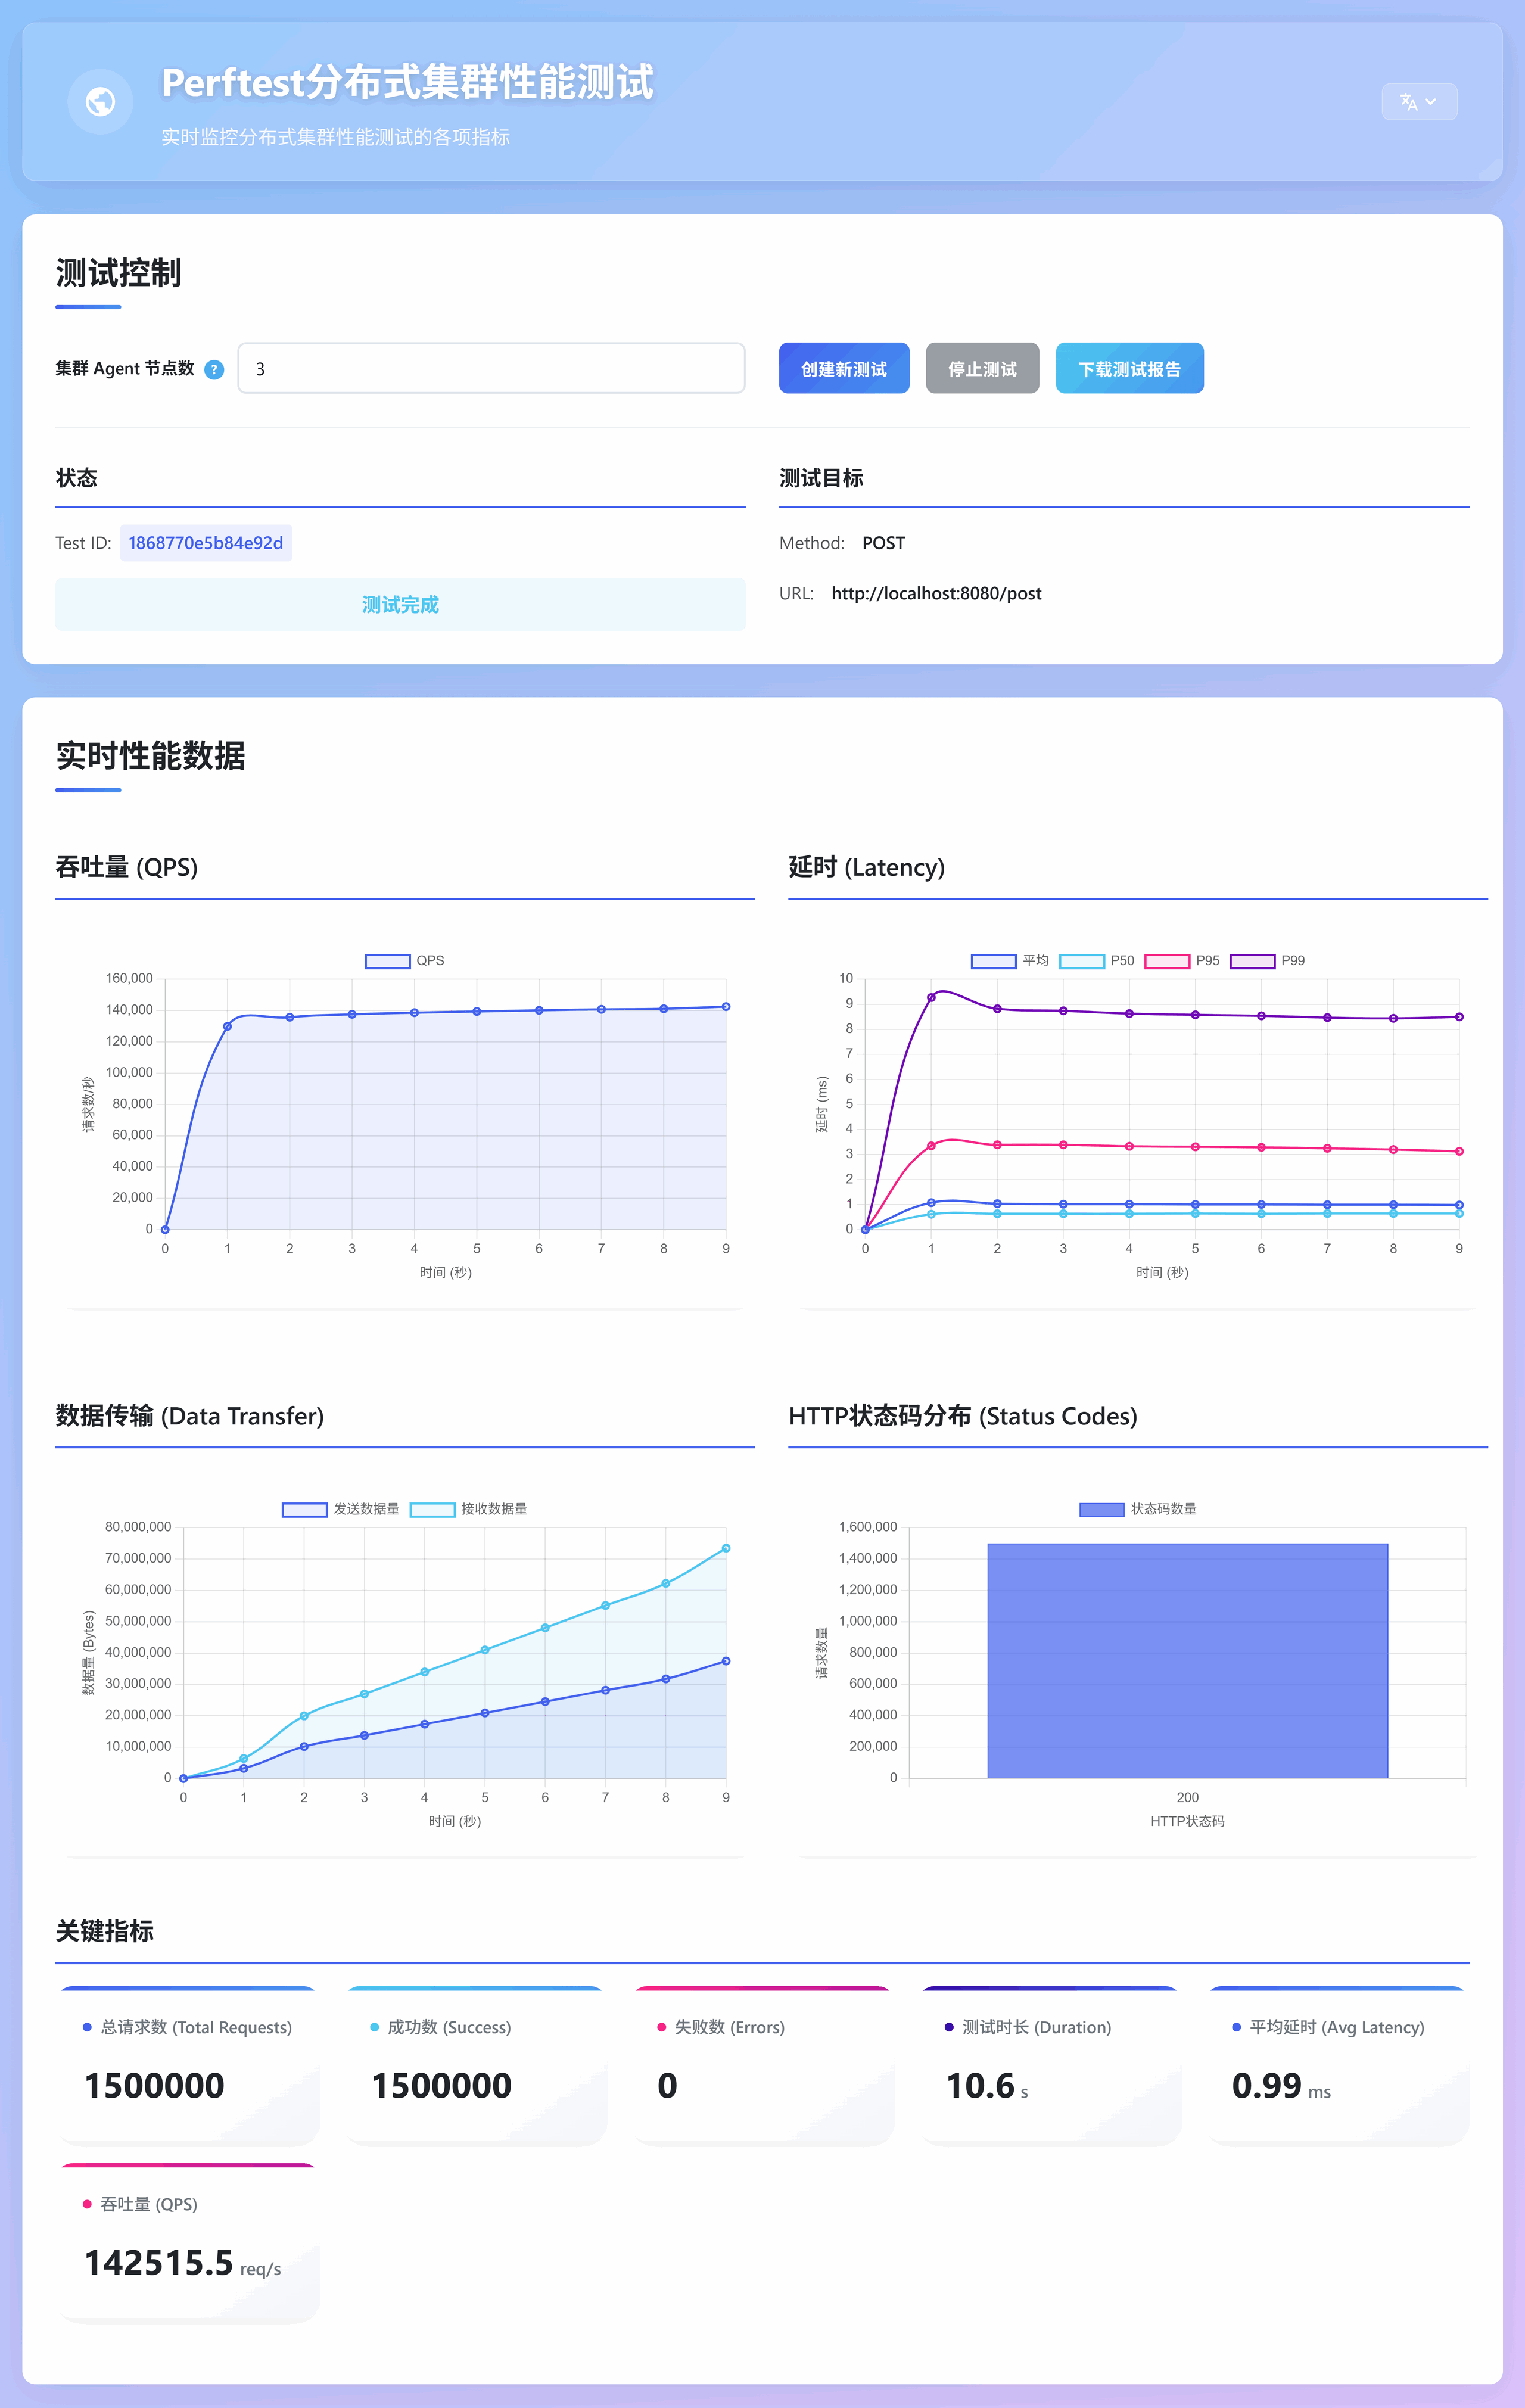
测试结束后,点击 下载测试报告 按钮,可将统计报告(Markdown 格式)保存到本地以便后续分析。
若需修改测试目标(如 testURL、method 等),只需更新 agent.yml 文件,Agent 会自动加载新配置,无需重启 Agent 进程。
在 Kubernetes 上部署 perftest
对于大规模测试,手动管理节点是不现实的。perftest 可以轻松部署在 Kubernetes 上,让您能够毫不费力地扩展您的 agent 数量。
我们提供了一个完整的 yaml 部署清单:
点击查看 perftest-deployment.yml
# -----------------------------------------------------------------------------
# -- Namespace: 用于隔离性能测试相关的所有资源
# -----------------------------------------------------------------------------
apiVersion: v1
kind: Namespace
metadata:
  name: perftest

---

# -----------------------------------------------------------------------------
# -- Collector Deployment: 管理Collector Pod的部署
# -- 关键点:
# -- 1. replicas: 1, 确保集群中只有一个collector实例。
# -- 2. command/args: 定义容器的启动命令和参数,监听8888端口。
# -- 3. podAntiAffinity: 定义了反亲和性规则,使其"优先"不与任何带有"app: agent"标签的Pod调度到同一个节点上,
# --    以避免关键的collector节点与消耗大量资源的agent节点竞争资源。
# -----------------------------------------------------------------------------
apiVersion: apps/v1
kind: Deployment
metadata:
  name: collector
  namespace: perftest
  labels:
    app: collector
spec:
  replicas: 1
  selector:
    matchLabels:
      app: collector
  template:
    metadata:
      labels:
        app: collector
    spec:
      containers:
        - name: collector
          image: zhufuyi/perftest:latest
          imagePullPolicy: IfNotPresent
          # 定义容器启动命令和参数
          command: ["collector"]
          args: ["-a", "http://$(NODE_IP):30088"]                     # 方式一:选项 -a 指定collector的监听地址为节点IP:30088
          #args: ["-a", "http://<LoadBalancer-Fixed-IP>:8888"] # 方式二:选项 -a 填入 LoadBalancer 将会分配的固定 IP 或解析到该 IP 的域名
          #args: ["-a", "http://perftest.yourcompany.com"]        # 方式三:选项 -a 填入 Ingress Controller 的入口
          ports:
            - containerPort: 8888
              name: http
          # 使用Downward API注入Node IP
          env:
            - name: NODE_IP
              valueFrom:
                fieldRef:
                  # fieldPath: status.hostIP 引用了Pod所在节点的IP地址
                  fieldPath: status.hostIP
#      # 强制 Pod 只调度到拥有 role=collector-node 标签的节点,先确保有节点打上标签,命令:kubectl label nodes <node-name> role=collector-node
#      nodeSelector:
#        role: collector-node
#      # 使用Pod反亲和性规则:
#      affinity:
#        podAntiAffinity:
#          # "preferredDuringSchedulingIgnoredDuringExecution" 表示这是一个"软"限制。
#          # 如果调度器找不到满足条件的节点,它仍然会将Pod调度到某个节点上,但会优先选择没有agent Pod的节点。
#          preferredDuringSchedulingIgnoredDuringExecution:
#            - weight: 100 # 权重值,范围1-100,数值越大,优先级越高。
#              podAffinityTerm:
#                labelSelector:
#                  matchExpressions:
#                    - key: app
#                      operator: In
#                      values:
#                        - agent
#                topologyKey: "kubernetes.io/hostname" # "topologyKey"定义了隔离的范围,这里是按"节点"(hostname)进行隔离。

---

# -----------------------------------------------------------------------------
# -- Collector Internal Service (ClusterIP): 对集群内部暴露Collector服务
# -- 作用:
# -- 为所有agent Pod提供一个稳定、唯一的DNS入口(collector-service.perftest.svc.cluster.local),
# -- 用于服务发现和注册。即使Collector Pod重启或漂移,其IP变化,该Service的地址也不会变。
# -----------------------------------------------------------------------------
apiVersion: v1
kind: Service
metadata:
  name: collector-service
  namespace: perftest
spec:
  type: ClusterIP # 默认类型,仅在集群内部可访问
  selector:
    app: collector # 将流量转发到带有"app: collector"标签的Pod
  ports:
    - protocol: TCP
      port: 8888       # Service监听的端口
      targetPort: 8888 # 流量转发到的目标Pod的端口

---

# -----------------------------------------------------------------------------
# -- Collector External Service (NodePort): 对集群外部暴露Collector的Web UI
# -- 作用:
# -- 允许用户通过访问任何一个集群节点的IP地址加上一个特定的端口号来访问Collector的UI界面。
# -----------------------------------------------------------------------------
apiVersion: v1
kind: Service
metadata:
  name: collector-external-service
  namespace: perftest
spec:
  type: NodePort         # 将服务暴露在每个节点的IP上的一个静态端口上
  #type: LoadBalancer   # 使用云厂商提供的负载均衡器,将服务暴露在公网上
  selector:
    app: collector
  ports:
    - protocol: TCP
      port: 8888           # Service在集群内部监听的端口
      targetPort: 8888  # 流量转发到的目标Pod的端口
      nodePort: 30088  # 如果不指定,Kubernetes会自动分配一个30000-32767范围内的端口

---

# -----------------------------------------------------------------------------
# -- Agent ConfigMap: 存储agent节点的配置文件 (agent.yml)
# -- 关键点:
# -- 1. collectorHost: 指向collector的内部ClusterIP Service,确保agent能稳定地找到collector。
# -- 2. agentHost: 在agent容器启动时被动态替换为Pod的实际IP地址。
# -----------------------------------------------------------------------------
apiVersion: v1
kind: ConfigMap
metadata:
  name: agent-config
  namespace: perftest
data:
  agent.yml: |
    # 1. 测试协议配置,支持: http | http2 | http3
    protocol: http

    # 2. 测试目标API配置
    testURL: "http://localhost:8080/get"
    method: "GET" # 支持 GET | POST | PUT | PATCH | DELETE
    body: ""          # 支持数据类型: JSON |  Form-data | Text。 JSON 示例: {\"key1\": \"value1\", \"key2\": \"value2\"}
    headers:
      - "Authorization: Bearer <token>"
      #- "Content-Type: application/json"

    # 3. 测试策略配置, 支持持续时间与固定请求数两种策略,选择其中一种
    duration: 10s         # test duration (e.g., 10s, 1m)
    #total: 500000       # total requests to send

    # 4. collector 和 agent 服务地址配置,确保 collector 服务和 agent 服务能互相访问
    collectorHost: "http://collector-service.perftest.svc.cluster.local:8888"
    #agentHost: ""  # 由Downward API注入的Pod IP动态替换,http://<POD_IP>:6601
    agentPushInterval: 1s

---

# -----------------------------------------------------------------------------
# -- Agent Deployment: 管理Agent Pod的部署
# -- 关键点:
# -- 1. replicas: 部署agent实例数量。
# -- 2. podAntiAffinity: 定义了反亲和性规则,"优先"将agent Pod分散调度到不同的物理节点上,并避免资源争抢。
# -- 3. Downward API: 通过`valueFrom.fieldRef.fieldPath`将每个Pod自身的IP地址(`status.podIP`)注入到
# --    名为`POD_IP`的环境变量中。
# -- 4. ConfigMap: 将agent.yml配置文件挂载到每个agent Pod的`/etc/config/agent.yml`下。
# --    agent监听agent.yml配置文件的变化,并自动重载,无需重启Pod。
# -----------------------------------------------------------------------------
apiVersion: apps/v1
kind: Deployment
metadata:
  name: agent
  namespace: perftest
  labels:
    app: agent
spec:
  replicas: 20   # 根据集群规模调整
  selector:
    matchLabels:
      app: agent
  template:
    metadata:
      labels:
        app: agent
    spec:
      containers:
        - name: agent
          image: zhufuyi/perftest:latest
          imagePullPolicy: IfNotPresent
          command: ["agent"]
          args:
            - "--config=/etc/config/agent.yml" # 配置文件发生变化时,agent会自动重载
            - "--agent-ip=$(POD_IP)"
            - "--agent-id=$(POD_NAME)"
          # 使用Downward API将Pod IP注入为环境变量
          env:
            - name: POD_IP
              valueFrom:
                fieldRef:
                  fieldPath: status.podIP
            - name: POD_NAME
              valueFrom:
                fieldRef:
                  fieldPath: metadata.name
          volumeMounts:
            # 直接将ConfigMap中的key挂载为文件
            - name: config-volume
              mountPath: /etc/config/agent.yml # 挂载点是文件,而不是目录
              subPath: agent.yml              # 指定要挂载ConfigMap中的哪个key
      volumes:
        # 定义ConfigMap卷
        - name: config-volume
          configMap:
            name: agent-config
      affinity:
        podAntiAffinity:
          # "preferredDuringSchedulingIgnoredDuringExecution" 表示这是一个"软"限制。
          # 调度器会尽力将agent Pod分散到不同节点,如果找不到合适的节点,它也允许在同一个节点上调度多个agent Pod。
          preferredDuringSchedulingIgnoredDuringExecution:
            - weight: 100
              podAffinityTerm:
                labelSelector:
                  matchExpressions:
                    - key: app
                      operator: In
                      values:
                        - agent
                topologyKey: "kubernetes.io/hostname"
1. 应用部署清单
确保您的 kubectl 已配置好并连接到目标集群,然后运行:
kubectl apply -f perftest-deployment.yml该命令将创建一个 perftest 命名空间,并部署 Collector 和一组 Agent Pod。
2. 验证部署状态
检查资源状态。拉取容器镜像和启动所有 Pod 可能需要一些时间。
# 查看 perftest 命名空间中的所有资源
kubectl get all -n perftest

# 监控 agent deployment 的上线进度
kubectl rollout status deployment/agent -n perftest
3. 访问 Collector UI
默认情况下,服务通过 NodePort 暴露。您也可以根据需要修改部署清单,使用 LoadBalancer 或 Ingress。
查找分配的 NodePort:
kubectl get svc collector-external-service -n perftest输出将显示类似 8888:30088/TCP 的端口映射。请使用那个范围较大的端口 (例如 30088)。
在浏览器中通过 http://<您的节点IP>:<NodePort> 访问 UI,例如:http://192.168.1.100:30088。
4. 运行测试
在 Web 界面中,输入您在部署文件中定义的 agent 副本数 (例如 20),然后点击开始测试,Agents 将自动注册,测试随之开始。测试结果会实时展示在界面中,测试结束后,点击下载测试报告保存结果。
5. 修改测试配置
如果需要修改测试目标(如 testURL、method 等),可以直接编辑 agent-config ConfigMap:
kubectl edit configmap agent-config -n perftestAgent Pod 会自动检测到配置变更并重新加载,无需重启 Pod。