Tracing (OpenTelemetry)
Overview
tracer is a component encapsulated based on go.opentelemetry.io/otel. It provides link tracing capabilities for microservices.
Example of use
Initialize the trace, specifying exporter and resource.
import "github.com/go-dev-frame/sponge/pkg/tracer"

func initTrace() {
    // exporter := tracer.NewConsoleExporter() // output to terminal

    // exporter, f, err := tracer.NewFileExporter("trace.json") // output to file

    // exporter, err := tracer.NewJaegerExporter("http://localhost:14268/api/traces") // output to jaeger, using collector http
    exporter, err := tracer.NewJaegerAgentExporter("192.168.3.37", "6831") // output to jaeger, using agent udp

    resource := tracer.NewResource(
        tracer.WithServiceName("your-service-name"),
        tracer.WithEnvironment("dev"),
        tracer.WithServiceVersion("demo"),
    )

    tracer.Init(exporter, resource) // collect all by default
    // tracer.Init(exporter, resource, 0.5) // collect half
}
Create a span in the program with ctx derived from the previous parent span.
    _, span := otel.Tracer(serviceName).Start(
        ctx,
        spanName,
        trace.WithAttributes(attribute.String("foo", "bar")), // customised attributes
    )
    defer span.End()

    // ......
Single-Service Tracing Example
Starting Jaeger and Elasticsearch Services
Distributed tracing uses Jaeger for tracing and Elasticsearch for storage. You can start both services locally using docker-compose.
(1) Elasticsearch Service
Here is the script for starting the Elasticsearch service. The .env file contains Elasticsearch configuration. To start the Elasticsearch service, run:
docker-compose up -d(2) Jaeger Service
Here is the script for starting the Jaeger service. The .env file contains Jaeger configuration. To start the Jaeger service, run:
docker-compose up -d
Access the Jaeger query homepage in your browser at http://localhost:16686.
Running the Example Service
Use sponge to create a Web service based on SQL. After extracting the code, open the configuration file to enable the link tracing function, as shown below:
app:
  enableTrace: true         # Whether tracing is enabled, true: enable, false: disable. If true, jaeger configuration must be set.
  tracingSamplingRate: 1.0   # Tracing sampling rate, range 0~1.0 float. 0 means no sampling, 1.0 means sampling all links.

jaeger:
  agentHost: "127.0.0.1"
  agentPort: 6831
Execute commands at the terminal to run services:
# generate swagger docs
make docs

# build and run the service
make run
Copy http://localhost:8080/swagger/index.html into your browser to access the Swagger homepage. As an example, for a GET request, make two consecutive requests with the same ID. The distributed tracing results are shown in the following image:
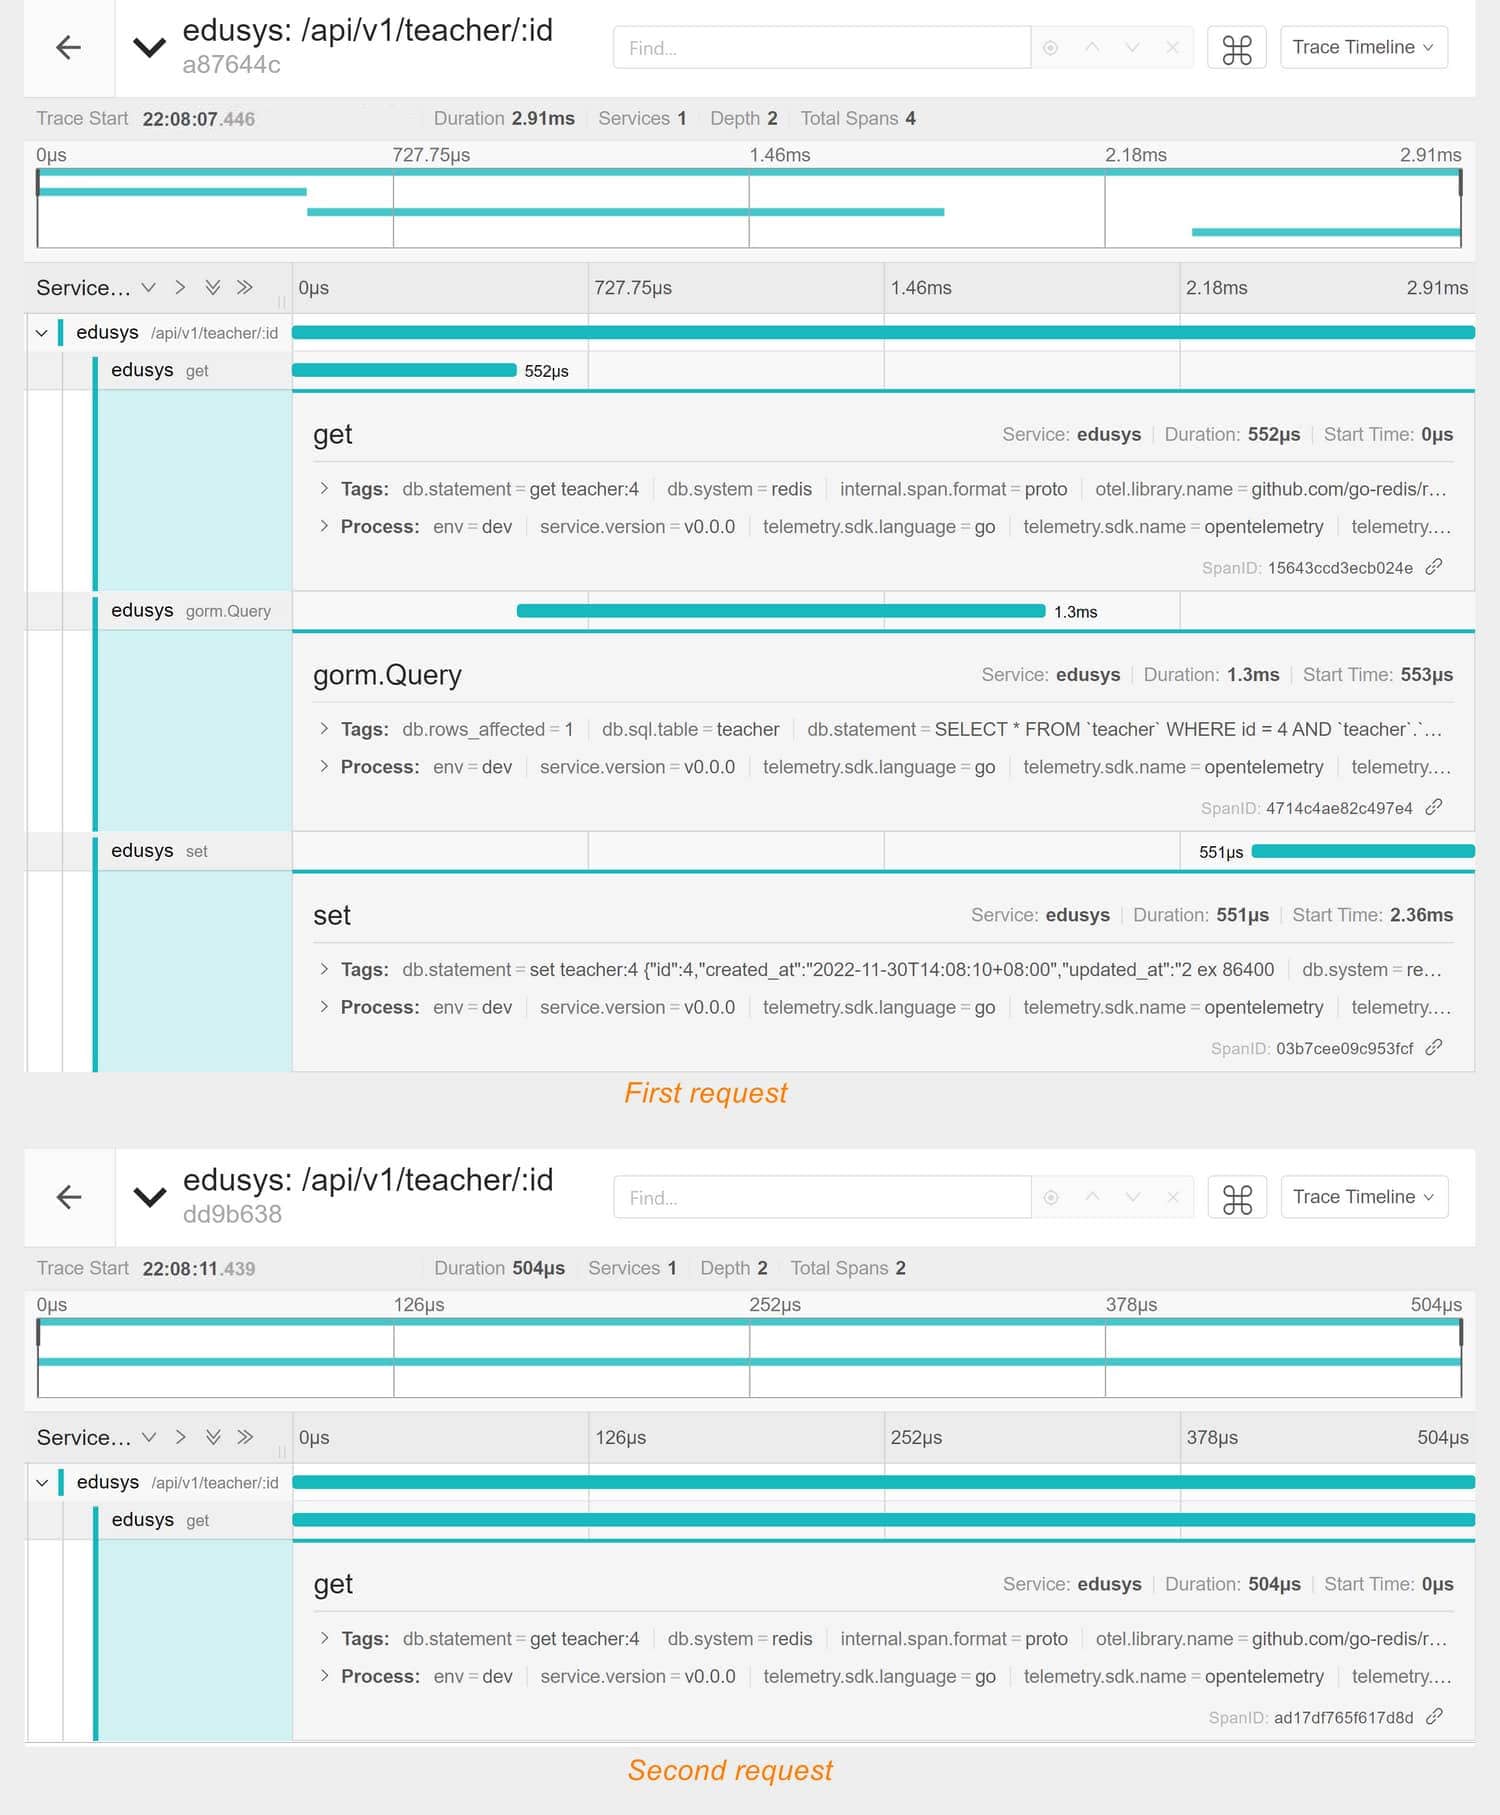
From the image, you can see that the first request consists of 4 spans:
- Request to the interface /api/v1/teacher/1
- Redis query
- MySQL query
- Redis cache set
This indicates that the first request checked Redis, did not find a cache, retrieved data from MySQL, and finally set the cache.
The second request only has 2 spans:
- Request to the interface /api/v1/teacher/1
- Redis query
This means that the second request directly hit the cache, skipping the MySQL query and cache setting processes.
These spans are automatically generated, but often you may need to manually add custom spans. Here's an example of adding a span:
import "github.com/go-dev-frame/sponge/pkg/tracer"

tags := map[string]interface{}{"foo": "bar"}
_, span := tracer.NewSpan(ctx, "spanName", tags)
defer span.End()
Multi-Service Tracing Example
Taking a simplified e-commerce microservices cluster as an example, you can see the source code here. This cluster consists of four services: shopgw, product, inventory, and comment. Modify the YAML configuration for each of these services (located in the configs directory) to enable distributed tracing and provide Jaeger configuration details.
In the product, inventory, and comment services, locate the template files in the internal/service directory and replace panic("implement me") with code that allows the service to run correctly. Additionally, manually add a span and introduce random delays in the code.
Start the shopgw, product, inventory, and comment services. Access http://localhost:8080/apis/swagger/index.html in your browser and execute a GET request. The distributed tracing interface will look like the image below:
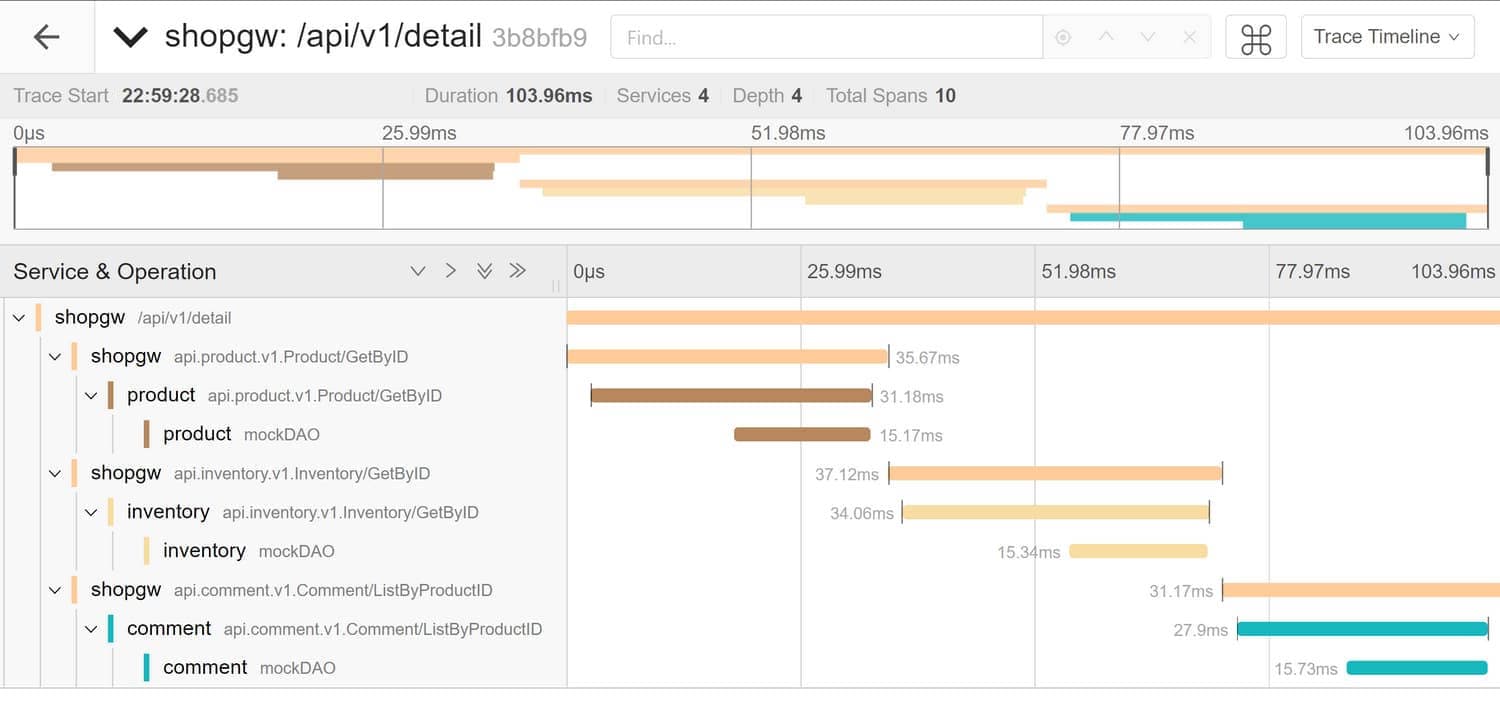
From the image, you can see a total of 10 spans in the primary trace:
- request to the
/api/v1/detailinterface shopgwservice invoking the grpc client-side ofproduct- grpc server-side in the
productservice - manually added mockDAO in the
productservice shopgwservice invoking the grpc client ofinventory- grpc server in the
inventoryservice - manually added mockDAO in the
inventoryservice shopgwservice invoking the grpc client ofcomment- grpc server in the
commentservice - manually added mockDAO in the
commentservice
The shopgw service sequentially calls the product, inventory, and comment services to fetch data. In practice, you can optimize this by making parallel calls to save time, but be mindful of controlling the number of concurrent goroutines.