Prometheus + Grafana Monitoring
Monitoring System Architecture
Services created by sponge support a complete monitoring data pipeline:
- Metrics Exposure: The service program provides metrics data through built-in components.
- Data Collection: Prometheus is responsible for scraping and storing metrics.
- Visualization: Grafana provides rich dashboard functionalities.
Services created by sponge have metrics collection enabled by default via the /metrics path, as shown in the configuration below:
app:
  enableMetrics: true    # Whether to enable metrics collection, true: enable, false: disable
Starting the Monitoring Services
1. Prometheus Service Deployment
Deployment Steps:
Execute the startup command:
docker-compose up -dAccess the web interface: http://localhost:9090
2. Grafana Service Deployment
Deployment Steps:
Get the Grafana service startup script
Execute the startup command:
docker-compose up -dAccess the web interface: http://localhost:33000
Configure the data source:
- Add Prometheus data source:
http://localhost:9090
- Add Prometheus data source:
Data Source Consistency Check
When importing the monitoring dashboard JSON, you must ensure that the datasource value is exactly the same as the Prometheus data source name configured in Grafana (defaults to "Prometheus"), otherwise the data will not be displayed.
Web Service Monitoring
Taking a Web service created based on SQL as an example, the default metrics endpoint is: http://localhost:8080/metrics
1. Prometheus Monitoring Configuration
Steps:
Modify the
prometheus.ymlconfiguration file to add a scrape target:- job_name: 'http-edusys' scrape_interval: 10s static_configs: - targets: ['localhost:8080']Note: Ensure the Prometheus container has permission to modify
prometheus.yml.Apply the configuration:
curl -X POST http://localhost:9090/-/reloadVerify the configuration: http://localhost:9090/targets
2. Grafana Monitoring Dashboard Configuration
- Import the HTTP monitoring dashboard
- Check for data source name consistency
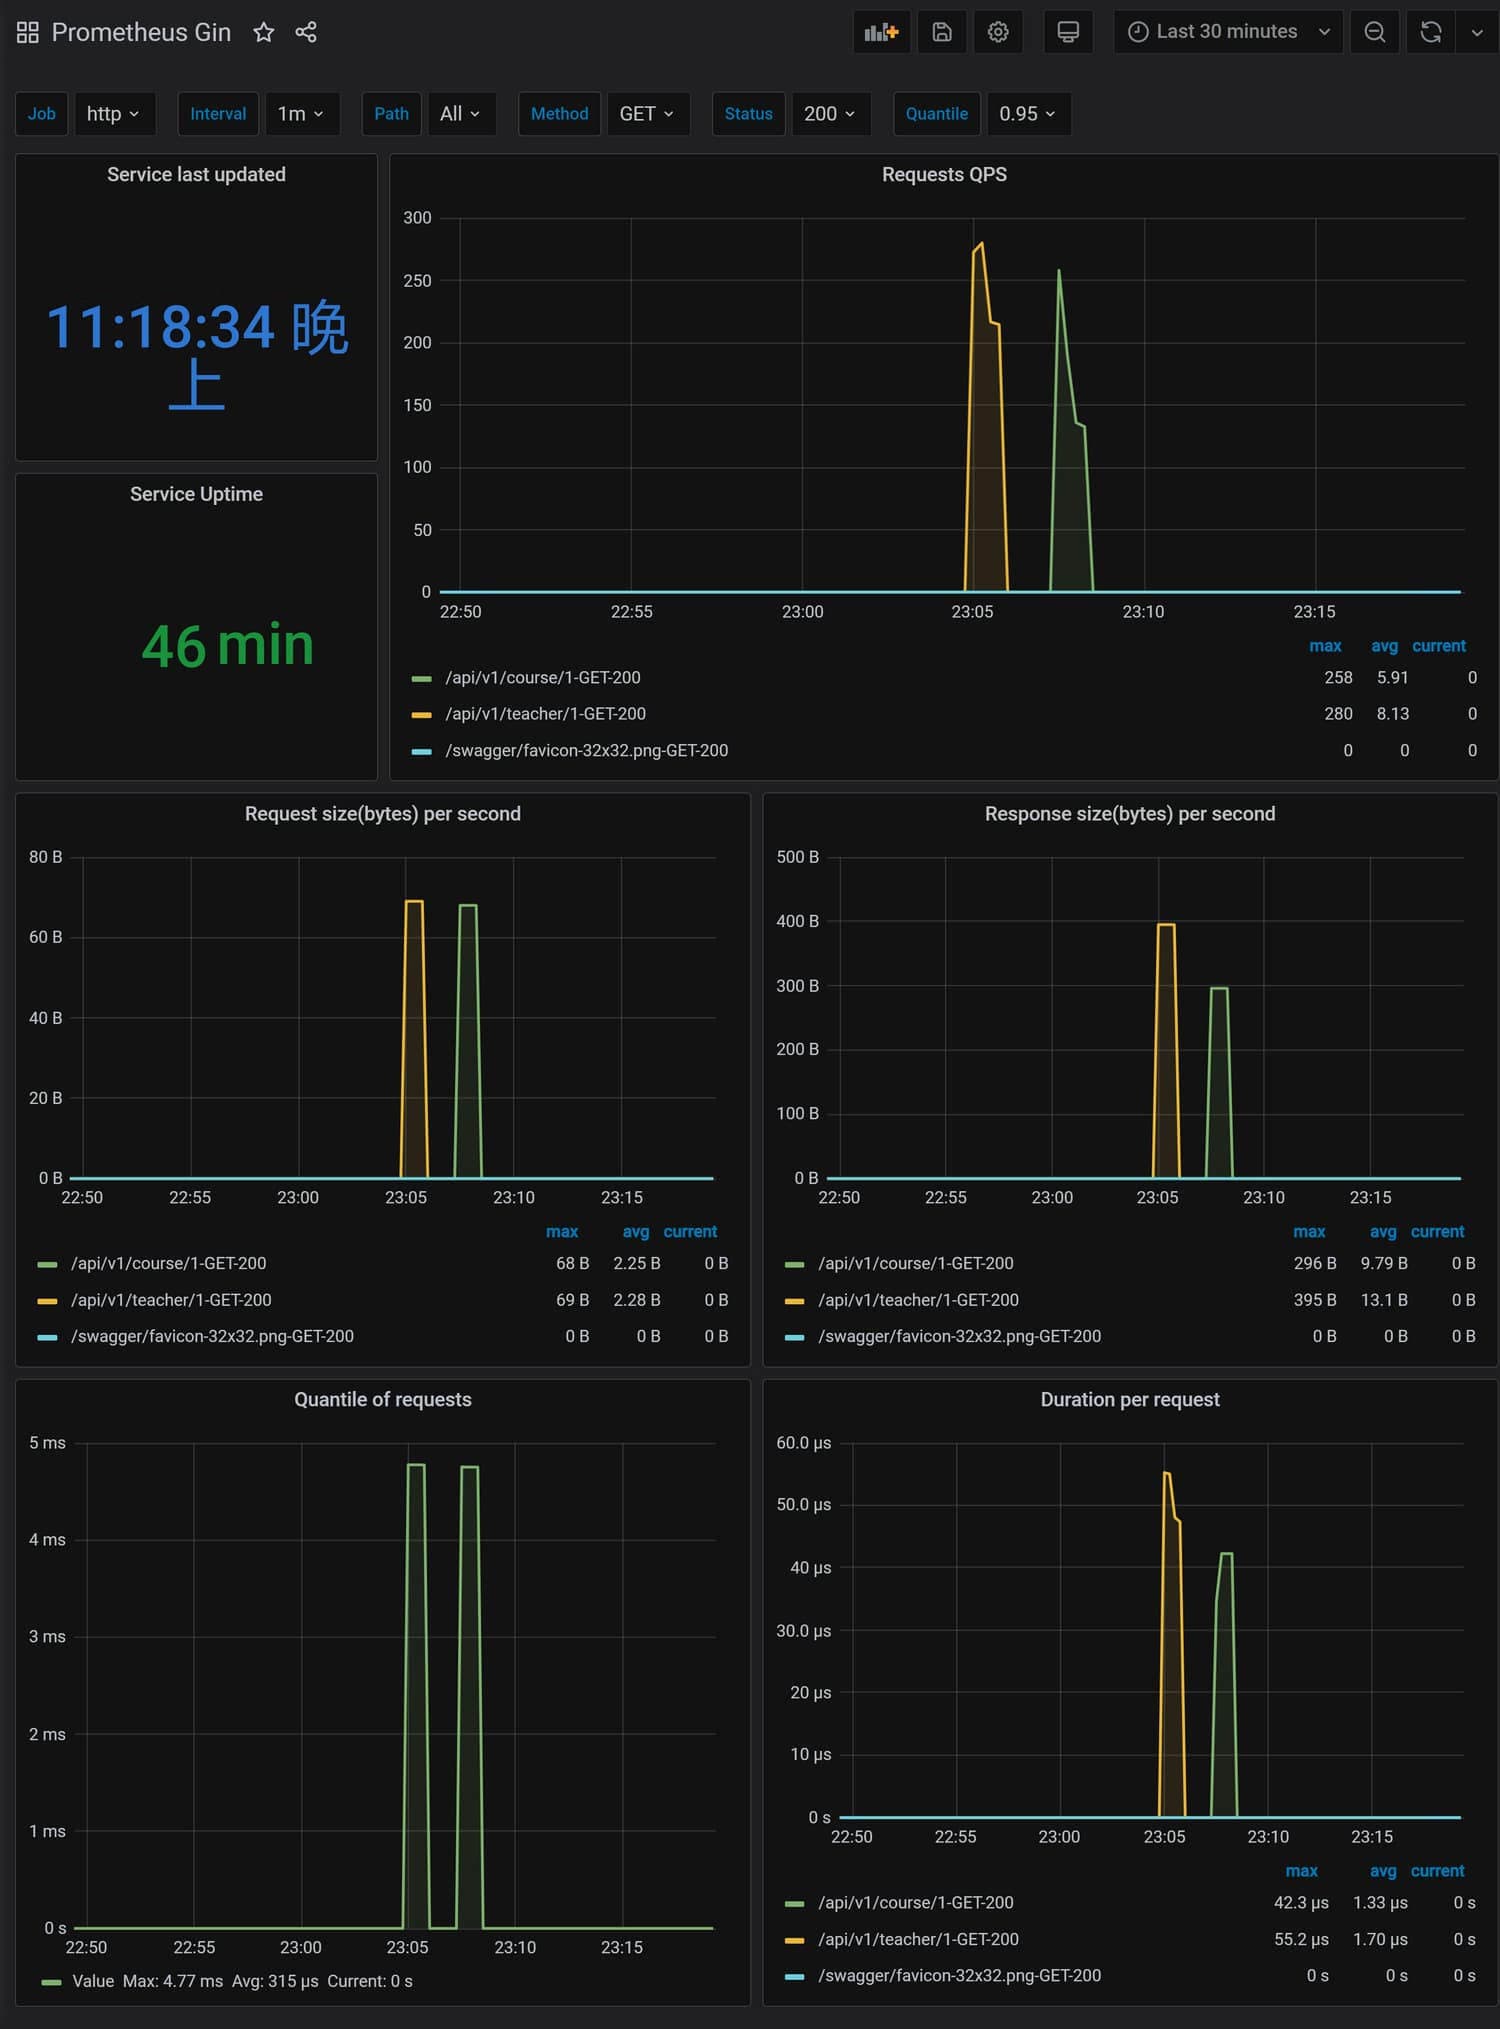
3. Interface Stress Testing and Monitoring
Use the wrk tool for stress testing:
# Test interface
wrk -t2 -c10 -d10s http://192.168.3.27:8080/api/v1/teacher/1

# Test interface
wrk -t2 -c10 -d10s http://192.168.3.27:8080/api/v1/course/1
Monitoring effect display:
gRPC Service Monitoring
Taking a gRPC service created based on SQL as an example, the default metrics endpoint is: http://localhost:8283/metrics
1. Prometheus Configuration
Steps:
Modify the
prometheus.ymlconfiguration file:- job_name: 'rpc-server-user' scrape_interval: 10s static_configs: - targets: ['localhost:8283']Apply and verify the configuration (same steps as for the Web service)
2. Grafana Configuration
- Import the gRPC Server monitoring dashboard
- Check for data source name consistency
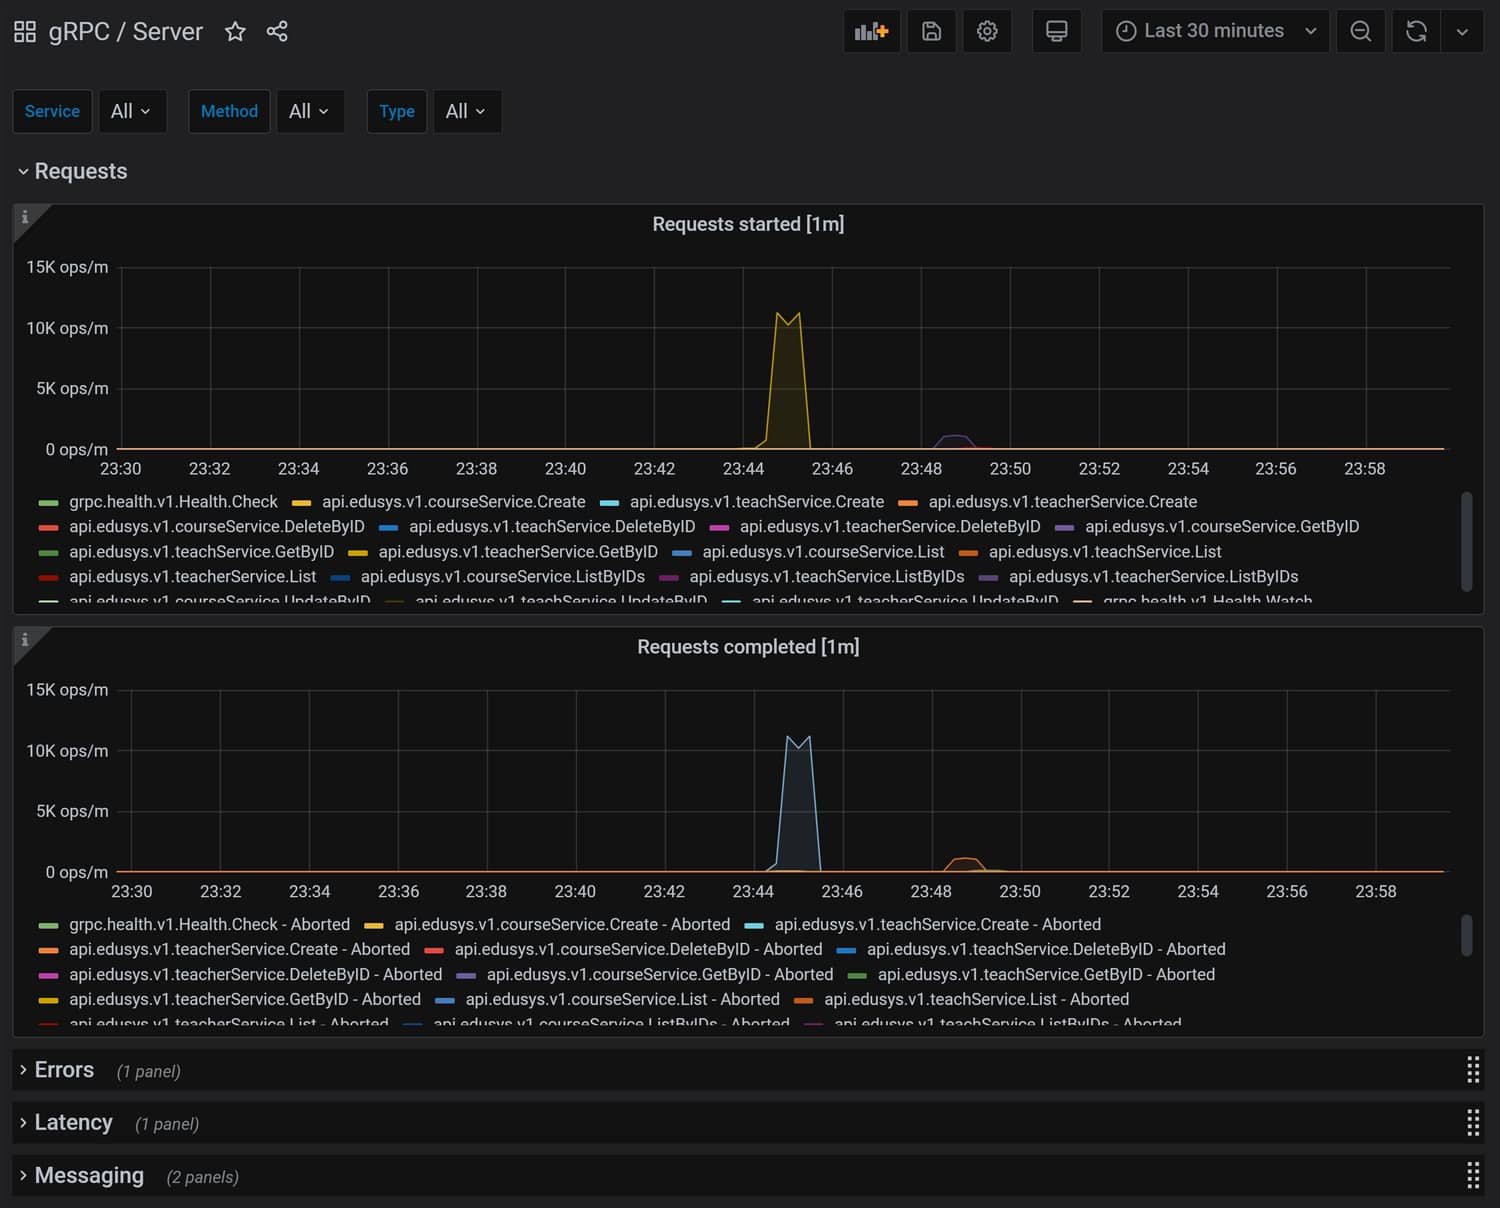
3. Interface Testing and Monitoring
Use the Goland IDE to test teacherService related methods, monitoring effect:
Client Monitoring
The gRPC client monitoring configuration is similar, use the gRPC Client monitoring dashboard
Dynamic Monitoring Target Management (Consul)
1. Consul Service Deployment
Deployment Steps:
Get the Consul service startup script
Execute the startup command:
docker-compose up -d
2. Prometheus Dynamic Configuration
Modify prometheus.yml to add Consul configuration:
  - job_name: 'consul-micro-exporter'
    consul_sd_configs:
      - server: 'localhost:8500'
        services: []
    relabel_configs:
      - source_labels: [__meta_consul_tags]
        regex: .*user.*
        action: keep
      - regex: __meta_consul_service_metadata_(.+)
        action: labelmap
After applying the configuration, register the service via the API:
curl -XPUT --data @user_exporter.json http://localhost:8500/v1/agent/service/register```

**Service Registration Example (user_exporter.json):**

```json
{
  "ID": "user-exporter",
  "Name": "user",
  "Tags": ["user-exporter"],
  "Address": "localhost",
  "Port": 8283,
  "Meta": {
    "env": "dev",
    "project": "user"
  },
  "Check": {
    "HTTP": "http://localhost:8283/metrics",
    "Interval": "10s"
  }
}
Verification address: http://localhost:9090/targets
Tips
In practical applications, it is recommended to automatically register services to Consul through the program to achieve automatic updates of monitoring targets when services start or stop.